“4 segments PowerPoint templates infographics” is a type of infographic template that is often used to present content with four sections or topics:
4 segments: Represents a diagram divided into four parts or topics. It is often used to describe four interrelated steps, concepts, stages, goals, categories, or other types of information.
Infographics: Emphasis is placed on expressing the information you want to convey more directly through graphics. The type of design is usually more intuitive and attractive than pure text.
Common Uses
Business Process: Demonstrate workflow.
Timeline: Describe key time points.
Classified Information: Display different types of data information.
Decision Points: Analyze and compare different options or solutions.
Common designs
Circle, square or other symmetrical structures.
Different colors, icons or numbers to distinguish each part.
Dynamic animation effects (in some premium templates).
If you need more detailed template examples or design inspiration, you can find relevant resources on design websites such as Canva, Bestppt, and Freepik.
To create 4 segments PowerPoint templates infographics, you need to follow the principles of simplicity, beauty and clarity:
1. Determine the theme and objectives
Be clear about what you want to show, such as:
Business process
Time node
Product classification
Data comparison
2. Open PowerPoint and set up
Open PowerPoint.
Set up your slide layout:
Click Design → Slide Size → Custom size if needed.
Choose a white or light background to make your chart stand out.
3. Create 4 partition structures
Common layout types:
Circular segmentation
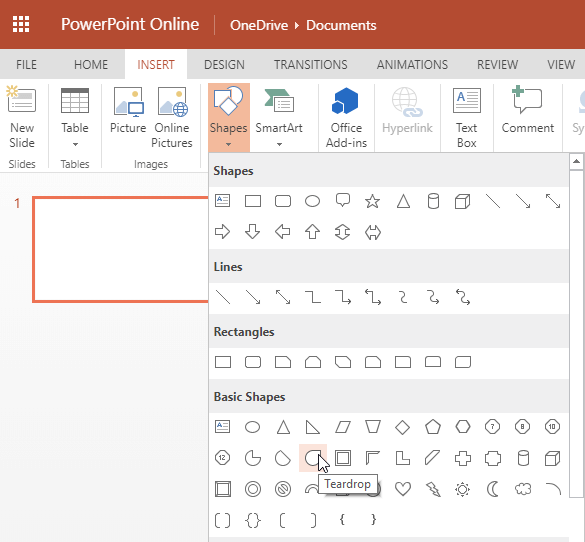
Insert a large circle (Insert → Shape → Circle) and divide it into four equal parts (either with lines or with different fill colors).
Add text and icons.
Rectangular or square layout
Insert 4 rectangles side by side or 2x2 (Insert → Shape → Rectangle).
Fill with different colors and adjust the size and position to maintain symmetry.
Arrow or flow layout
Use 4 connected arrows to represent steps (Insert → Shapes → Arrows).
Label each arrow with the corresponding information.
Layered or ring design
Use SmartArt tools:
Click Insert → SmartArt → Select a suitable graphic, such as a circle, hierarchy, etc.
4. Add text and icons
Insert a text box (Insert → Text Box) to fill in the title and brief description of each section.
Add an icon or image:
Adjust color and style
Color Matching: Choose a coordinating color scheme (such as complementary colors or gradients).
Click Shape → Format → Shape Fill.
Font Selection: Keep it legible with simple fonts like Arial, Calibri.
5. Alignment layout
Use the Alignment tools (Drawing Tools Format → Align) to make the diagram neat.
6. Add animation (optional)
Select the chart → click Animation → Add effects (such as fly-in, fade-in).
Adjust the animation order so that each part appears in sequence.
7. Save as Template
When you are finished, click File → Save As.
Select the .pptx format and save it as a PowerPoint template.
Recommended Tools
If you want to make it more efficiently, you can use professional tools or websites:
Canva (online design)
Bestppt(online production, download templates)

